- Sei expands its ecosystem with the official MORPHO launch, bringing DeFi lending and capabilities to the network.
- The token maintains key support levels around $0.18–$0.20, with technical indicators hinting at renewed buying pressure.
- Sei could target $0.75 if the ascending support line holds, marking the start of a potential recovery trend.
Sei (SEI) sees a mild pullback as waning investor sentiment mirrors the cautious mood across the wider crypto market. Its price has decreased by 9.02% over the last 24 hours and 29.91% over the last week.
At the time of writing, SEI is trading at $0.1918, supported by a market capitalization of $1.19 billion. Moreover, its trading volume has also surged 31.33% to $218.24 million, suggesting that investors anticipate a potential shift toward bullish momentum.
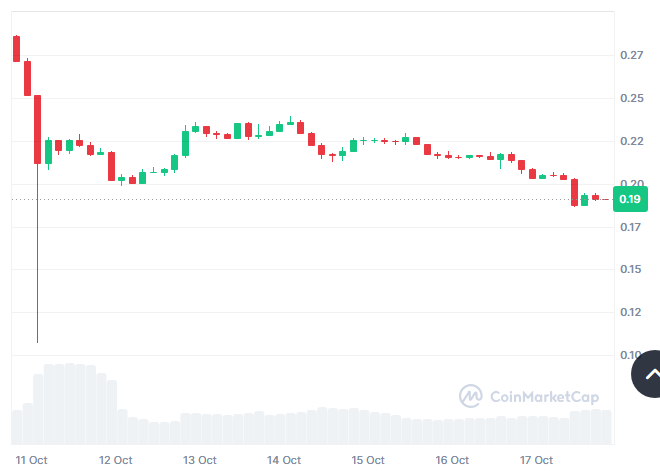
Source: CoinMarketCap
SEI Expands Ecosystem with MORPHO Launch
A prominent crypto analyst, Altcoin Buzz, revealed that MORPHO has officially launched on the SEI Network, marking a major leap for both ecosystems. This integration brings Morpho’s DeFi power to Sei’s ultra-fast Layer 1, delivering faster, smoother, and more efficient lending experiences. It further cements Sei’s reputation as the Red Chain for next-gen decentralized finance.
The launch strengthens Sei’s growing position as a leading hub for high-performance DeFi and cross-chain liquidity solutions. With MORPHO now part of the ecosystem, users can expect enhanced scalability, seamless execution, and deeper liquidity across multiple protocols and platforms.
Also Read: Sei Price Rally Gains Strength as Market Predicts Breakout Toward $0.90
SEI Triangle Pattern Signals Next Move Toward $0.75
Moreover, a prominent crypto analyst, Mister Crypto, revealed that the SEI chart reveals a clear descending triangle pattern, marked by consistent lower highs and a steadily rising support line. Price movement has been tightening within this range since late 2023, showing a phase of accumulation and reduced volatility. The recent bounce from around $0.18–$0.20 indicates a strong potential local bottom with renewed buying interest.
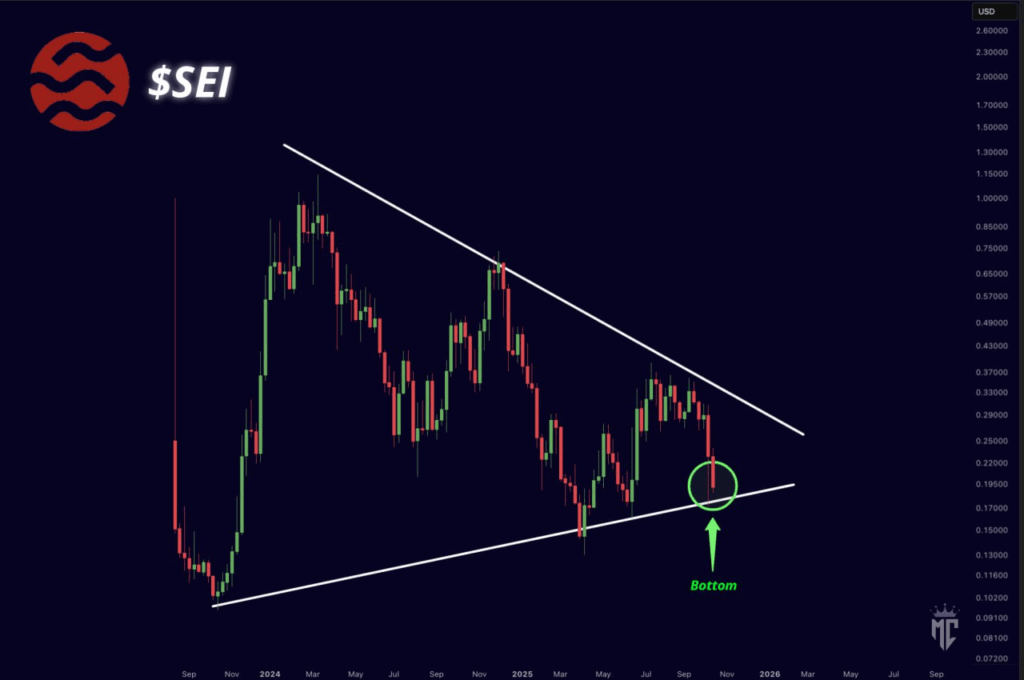
Source: X
In case the rising support keeps holding good, $SEI might make its step toward the higher resistance level around $0.35–$0.40 in the following weeks. A clear break above that falling trendline might bring a good bull reversal, aiming at the zone of $0.60–$0.75. On the contrary, in case the support doesn’t hold good, then its next big down target will remain around $0.12–$0.15, which will indicate higher correction potential.
SEI Technical Outlook Signals Further Weakness
SEI price chart reveals good selling pressure. Price has dropped sharply below the 20 EMA ($0.2753), which indicates that bearish momentum has gained strength. Long-term EMAs (50, 100, 200) remain in declining posture to validate that SEI still holds in a ongoing and stretched downtrend.
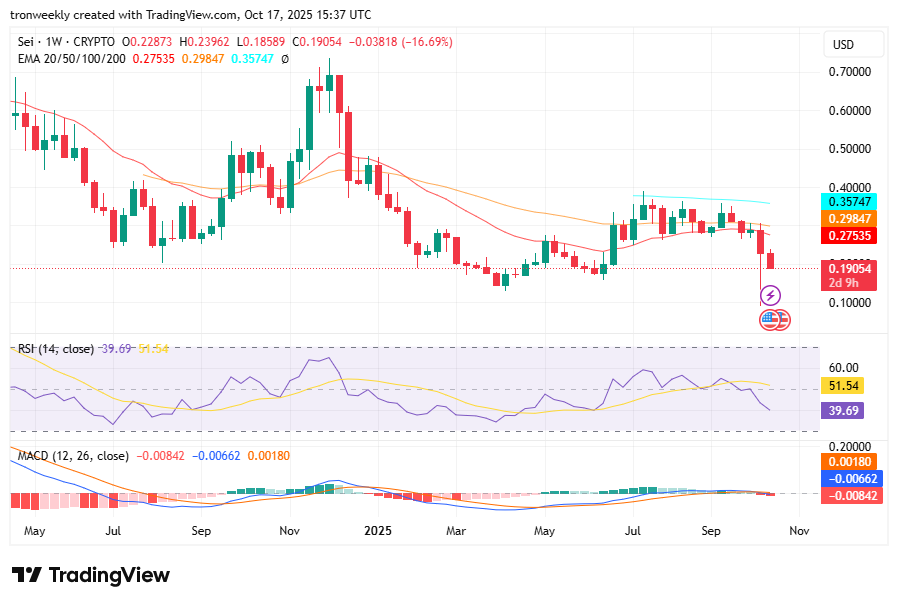
Source: TradingView
RSI stands at 39.69, with bearish sentiment and close to oversold levels. MACD stands below the signal line with enlarging red bars, supporting bearish momentum. In the absence of buying pressure in the near future, SEI could lower its course toward lower supports in the vicinity of around $0.15 or lower.
Also Read: SEI Price 0.64 Prediction Strengthens After Hamilton Lane Fund Launch
#Triangle #Pattern #Hints #Major #Move