- Bitcoin falls bottom while gold reaches the top, following the 2020 pattern.
- Analysts observe this trend, calling it “Gold Top = Bitcoin Bottom,” as the repetition of history.
- Both assets’ past performances from 20202-25 support the observation of correlation with market setup, reflecting the same.
Bitcoin and Gold are the mostly watched assets in the global market. While BTC is considered a high-risk digital asset, Gold remains as most trusted one. At press time, BTC is trading at $107,000 with strong momentum gold is at $4252.06 per ounce. In this article, we are going to analyse the performance of both assets that follow an opposite pattern.
Gold Top = Bitcoin Bottom
When gold was at its top in 2020, Bitcoin was just above its bearish zone. Now, after 5 years, both BTC and Gold are once again at the same potential turning point. Both traders and investors are closely watching the similarities.
According to the recent post from the user named AEx Wacy in X, Bitcoin’s cyclical volatility might once again create the same setup. This points to the trend that gold marked with the beginning of BTC’s breakout phase.
Also Read: Bitcoin Vs S&P 500: How the Crypto Outperformed Traditional Stocks Since 2020
History Repeats: Gold Tops Out When BTC Takes Lead
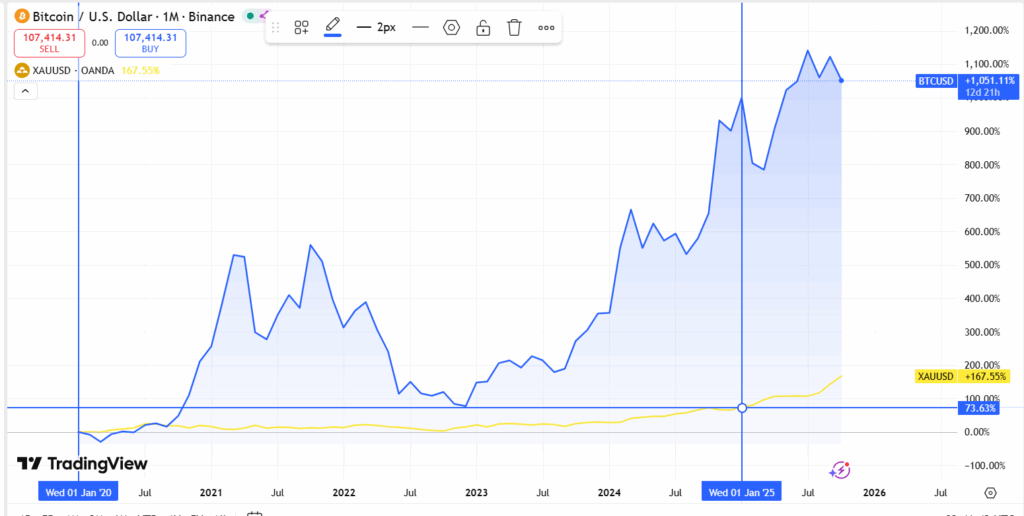
The chart from TradingView highlights the performance of BTC versus gold from 2020 to 2025. Bitcoin gained over 1000% from 2020-25, and gold up to 160%. In both cycles, gold moves up when BTC was in falls and slows down when BTC rises. When gold peaked in 2022, matching BTC’s bottom, it highlighted how often money is just shifted between safety and risk in the case of BTC.
Now in 2025, the setup seems to mirror 2020. This inverse relationship reinforces a new, powerful pattern. Gold’s top always coincides with BTC performances as investors shift interests. The macro conditions, the loosening policy, and renewed liquidity all resemble early 2020.BTc once again reclaims its leadership as gold’s rally starts to fade.
Daily Charts Hinting at Patterns of 2020
According to the data taken from TradingView, it shows BTC and gold rarely move together. From 2020 to 2025, Bitcoin (blue) has bounced to 1048%, far from Gold’s 167% increase, yet their correlation stayed mostly below 0.6. Sometimes turns negative during major market turns. This highlights that BTC is strong and gold often tends to cool off, and vice versa.
Now in 2025, the pattern seems similar as gold’s strength is fading just like BTC begins a new rally. Both assets are now trading in similar directions, even in today’s market conditions, with shifting liquidation and high inflation.
Conclusion
Both charts confirm the same pattern supporting the trend. When BTC rises, Gold cools off. In 2025, the setup is almost identical as observed by the analysts. History points to the market point where investors might move to risk when BTC reclaims its position from Gold.
Also Read: Bitcoin, Gold, and Silver ETFs Are Booming in 2025, but Paper Isn’t Enough
#Market #Trend #Similar