- Pi Network has dropped -44.47% in the last month and is down -85.90% over the past year.
- Short-term forecasts predict a further -23.13% decline in the next five days.
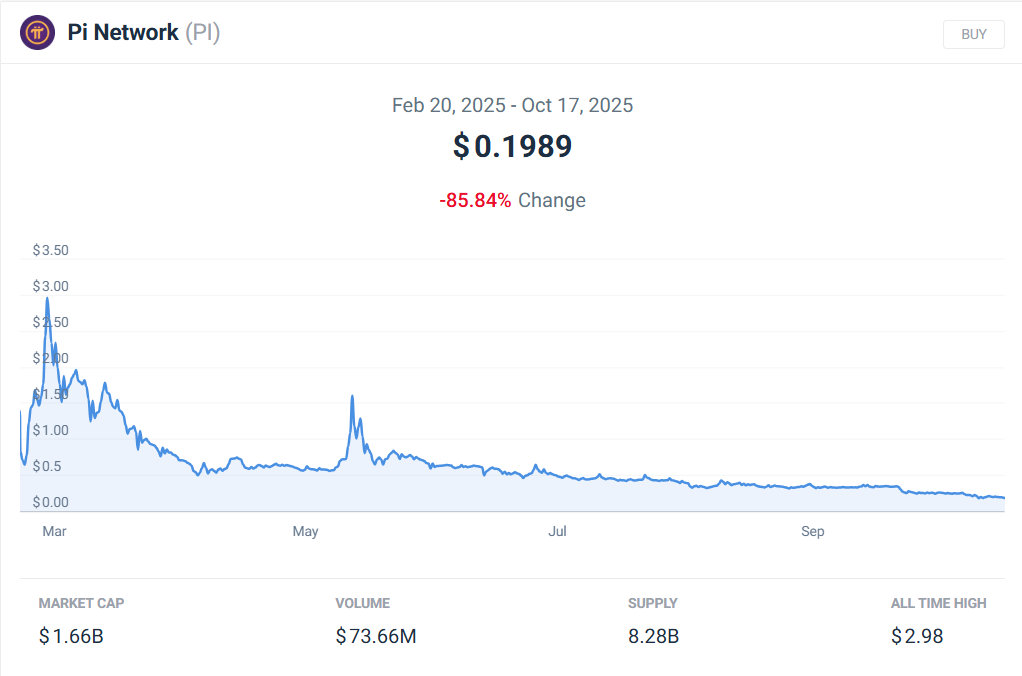
- Market sentiment for Pi Network is bearish, with extreme fear dominating investor outlook.
Today Pi Network (PI) lost -5.02% against the US Dollar. The coin did worse than the general cryptocurrency market, which fell 4.81% over the same time. Besides, PI went down 0.29% versus Bitcoin. However, PI is still 23.72% higher than its target level on October 22, 2025.
In the last 30 days, Pi Network suffered a huge decline of 44.47%. In three months it lost 55.82% and the long-term picture is really bad because of a 85.90% drop since last year. To give you an idea, one year ago PI was worth $1.40 and it reached its all-time high of $2.98 on February 26, 2025.
The coin’s price has been fluctuating a lot. Over the previous month, the 1-month volatility is 17.35, and there were only 11 days with positive price movement. At this moment, the peak of the cycle is $0.227455, and the lowest point is $0.164512.
Also Read: Pi Network Unveils DEX, AMM, and Token Tools on Testnet to Expand DeFi Ecosystem
Pi Network Technical Analysis
The bearish sentiment towards PI in the market has been further confirmed by the Fear & Greed index, and currently sits at 22, which signifies an extreme fear situation. This indicator is one of the main barometers for the investors’ feelings. Extreme fear may be an indication of a possible buying opportunity, but at the same time, it is also a sign of hesitation on the part of crypto investors.
The situation depicted by technical indicators is not clear but bears prevail. Only three indicators forecast positive trends, whereas the other 17 are leaning towards the negative, which makes it a total of 85% of the signals pointing in the negative direction. The eye-catching support levels to monitor are $ 0.199986, $ 0.194688, and $ 0.188414, while the resistance levels to be watching closely are $ 0.211559, $ 0.217833, and $ 0.223132.
RSI (Relative Strength Index) 14 is hovering around 26.45, which indicates that PI is in an oversold situation. The 50-day Simple Moving Average (SMA 50) is giving a bullish signal since PI is above it, but the long-term 200-day SMA indicates the market is bearish as PI is below it.
Road Ahead for Pi Network
Based on the predictions regarding the Pi Network price, PI, two years down the line, will be $0.159998, which is an indication of a -23.13% drop in the next five days. The actual trading situation will be influenced by market sentiment, support and resistance levels, and technical indicators. The apect of price fluctuation remains unpredictable in the digital currency market, and similarly, Pi Network is not an exception. On the other hand, price swings might create entry points, but still, it is advisable to be careful.
Also Read: Pi Network’s Bold Step Toward Mass Adoption
#Networks #Plunge #Alarming #Facts #Investors